5 Years Rain Return Flood Risk
About
5 Years Rain Return Flood Risk
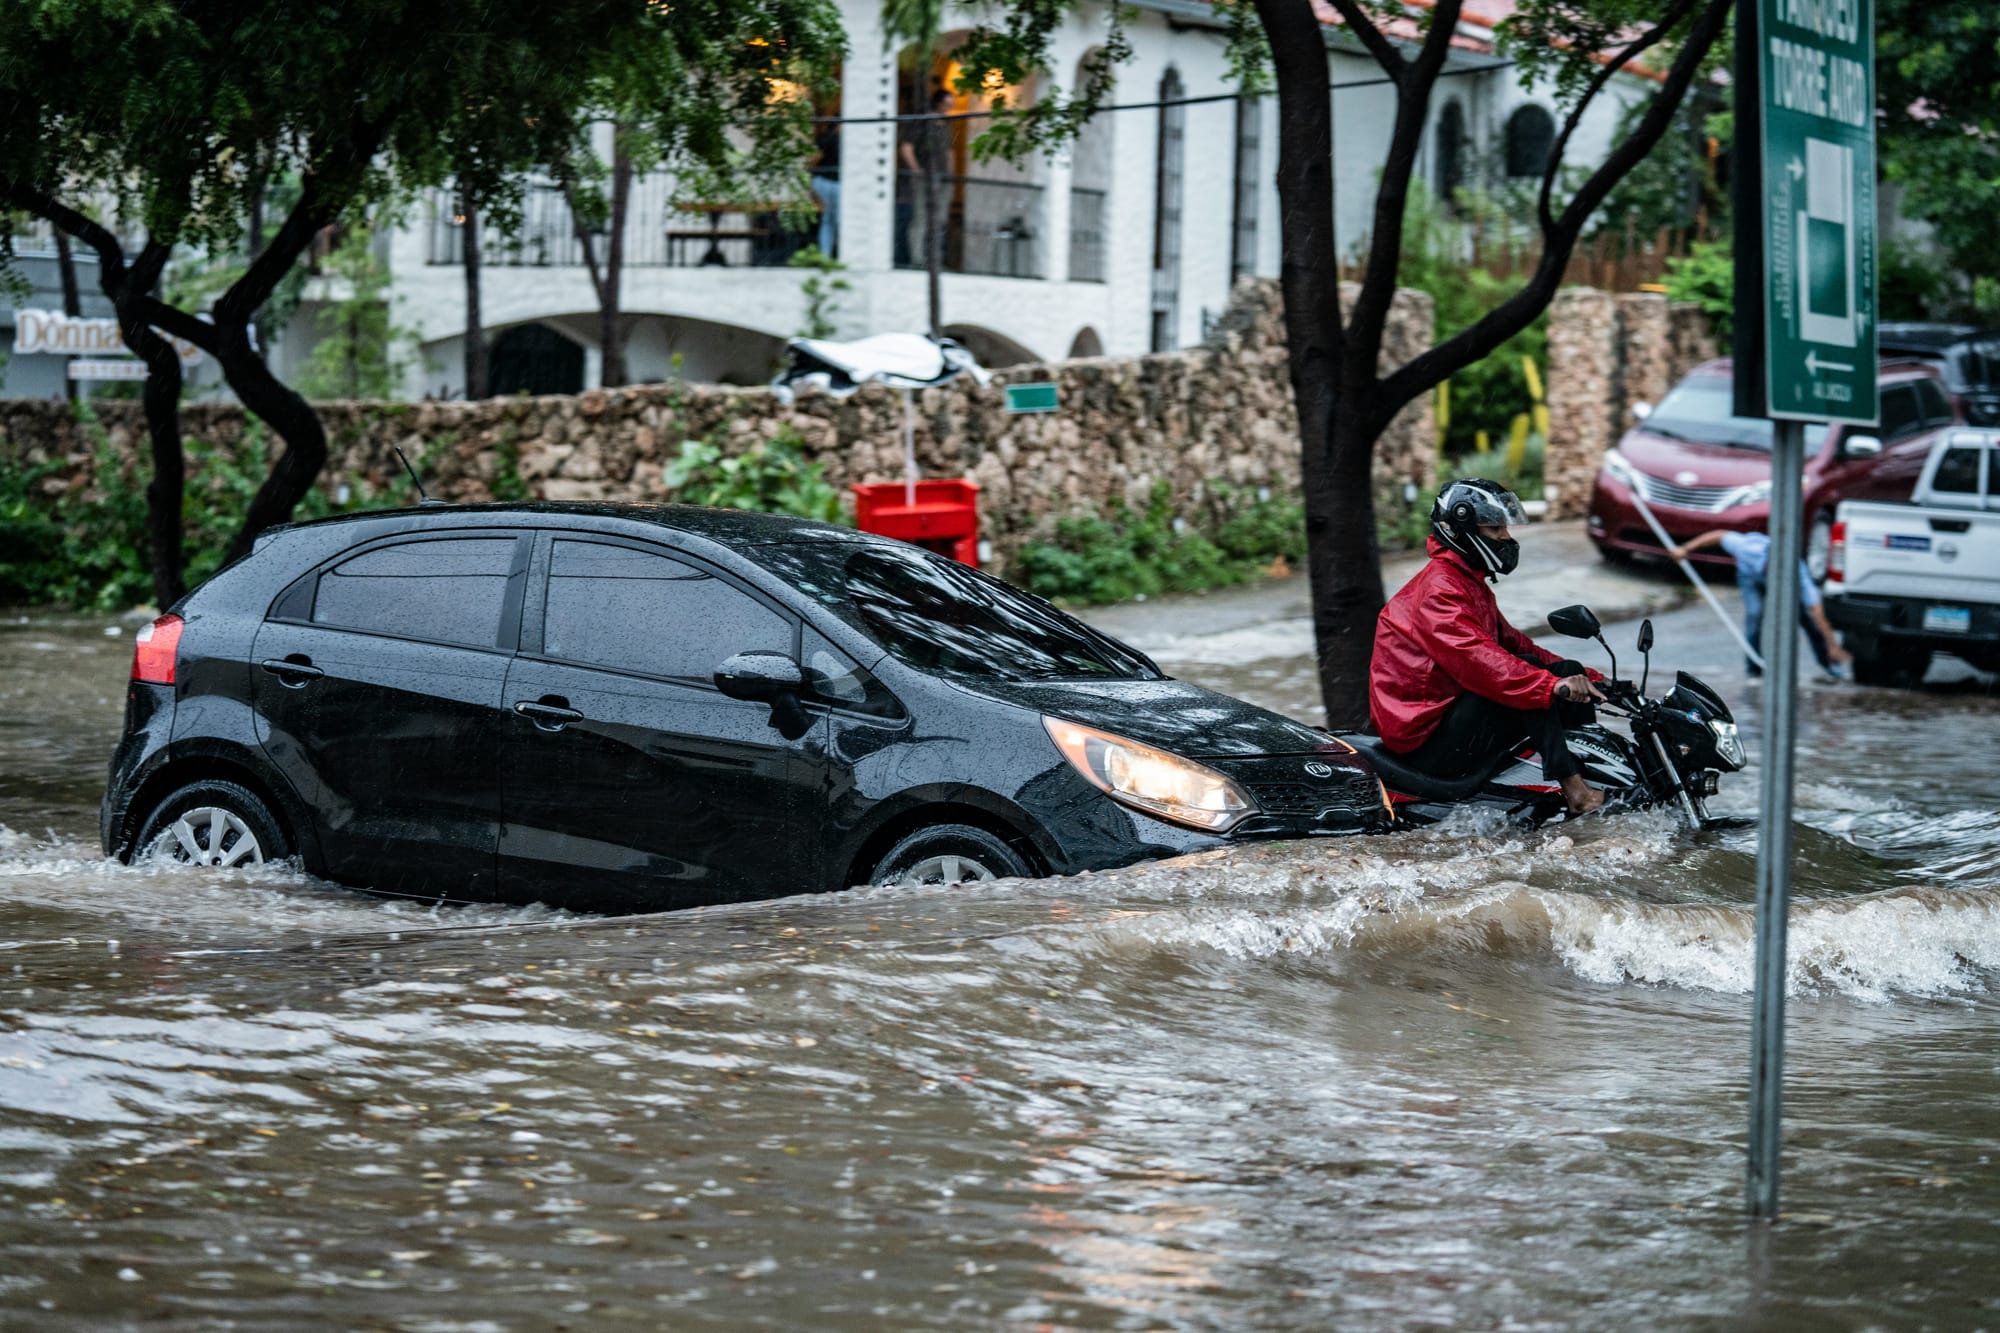 Photo by Aldward Castillo on Unsplash
What is "5-Year Rain Return"?
Rain return describes how often a certain amount of rain is expected to happen.
For example, a “5-Year Rain Return” means that this level of heavy rain has a 1 in 5 chance (or 20% chance) of happening in any given year.
It doesn’t mean that it only happens once every 5 years — it could happen this year, next year, or even more than once in the same year. Instead, it describes a common, but heavy rainfall event. In any single year, there is a 20% chance (or a 1-in-5 chance) of a storm this powerful (or stronger) happening.
Information visualized here is based on data from https://noah.up.edu.ph.
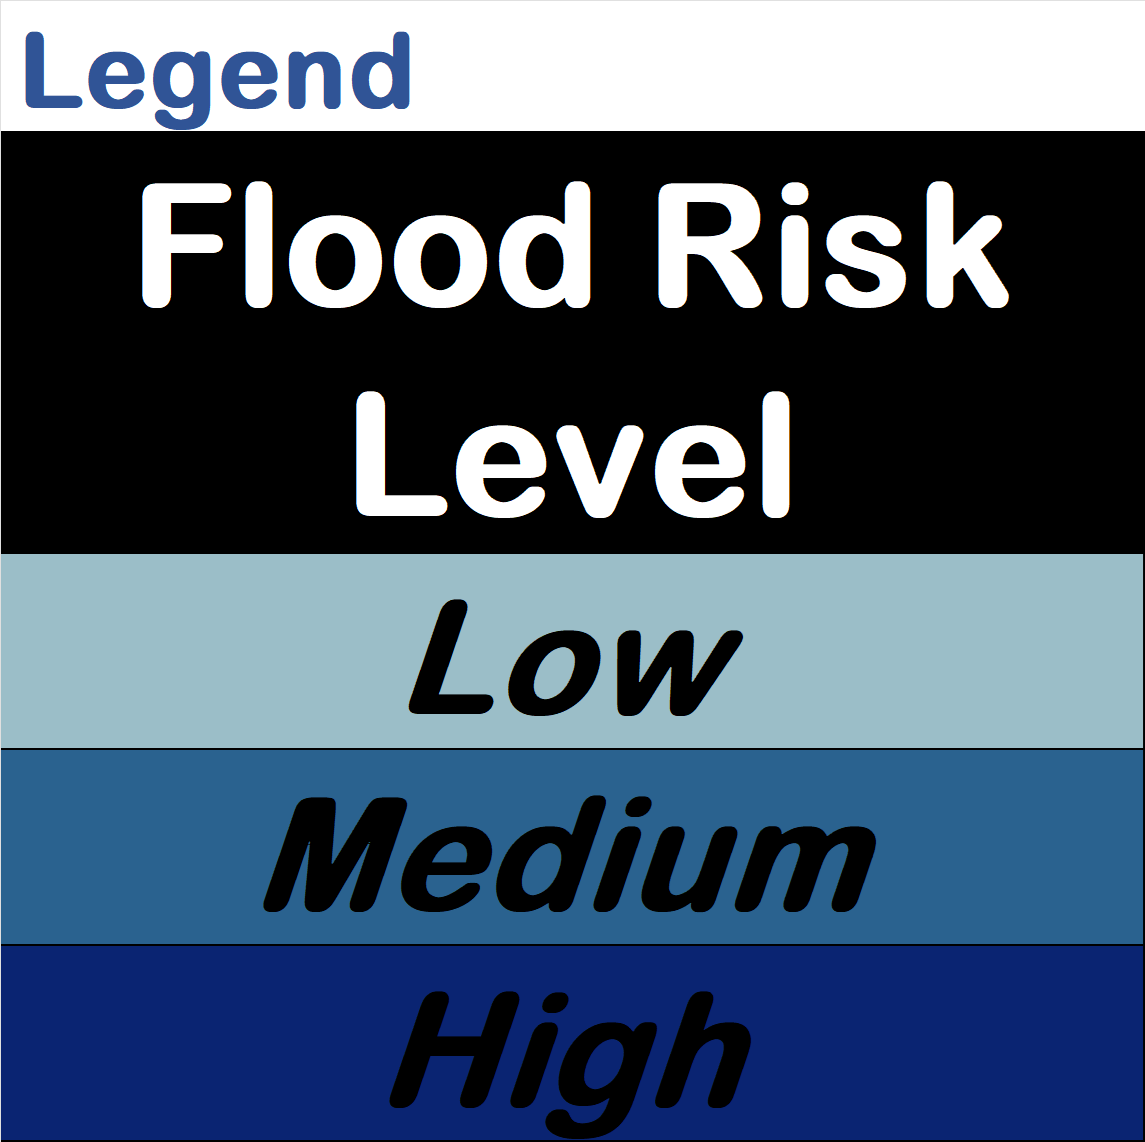
Understanding Flood Risk Levels
These risk levels help communities and planners understand which areas are more likely to flood during heavy rain, so they can prepare ahead of time.
Low Risk (0–0.5 meters)
- Flooding may be shallow and short-term.
- Good for identifying areas that need better drainage.
- Useful for planning home elevation or landscaping improvements.
- Communities can monitor these areas to prevent minor flooding from getting worse.
Medium Risk (>0.5–1.5 meters)
- Flooding could affect roads, yards, or the first floor of buildings.
- Consider raising electrical outlets or appliances.
- Plan evacuation routes and access to higher ground.
- Useful for city planning and zoning — avoid placing key facilities in these zones.
High Risk (>1.5 meters)
- Flooding can become deep and dangerous for people and property.
- Should be prioritized for major drainage projects or flood control structures.
- Residential or business development in these zones may need special building standards.
- Local governments can use this data to plan early warning systems and safe evacuation areas.
Disclaimer & Data Limitations
The flood hazard map presented here is intended for informational and planning purposes only.
Data Source & Scenarios: The flood hazard visualizations are based on data provided by Project NOAH (Nationwide Operational Assessment of Hazards).
The map displays different flood models based on Rain Return Periods. A return period is a statistical estimate of how likely a flood of a certain size is to occur in any given year.
5-Year Return: A common, high-probability flood event (20% chance of occurring in any year).
25-Year Return: A moderate, less-frequent flood event (4% chance of occurring in any year).
100-Year Return: An extreme, low-probability flood event (1% chance of occurring in any year).
Limitations of Use:
• This is not a real-time map. The data shown is from pre-computed models and does not represent current weather or actual, live flood conditions.
• Models have inherent limitations. The accuracy of the flood map can be affected by factors not included in the original models, such as:
• Sudden and extreme rainfall events.
• Blocked drainage, silted rivers, or failed levees.
• New construction, land-use changes, and other development.
•Tidal influences or storm surge (which may be separate models).
No Warranty: The developer(s) of this application provide this map "as is" and make no warranties, expressed or implied, regarding the accuracy, completeness, or reliability of the data. The user assumes all risks associated with its use.
Official Advisory: For emergency situations and real-time advisories, always refer to official announcements from PAGASA and your Local Disaster Risk Reduction and Management Office (LDRRMO).
What's Next
Our next step is to expand the map's capabilities by adding two new critical hazard layers:
Landslide Risk: We will integrate official rain-induced landslide susceptibility data. This will show areas with high, moderate, and low potential for landslides based on slope, soil, and other factors.
Storm Surge Risk: We will add the storm surge hazard maps from PAGASA. This layer will identify coastal areas vulnerable to inundation from storm surges, categorized by potential flood height.
Attribution
Data courtesy of: NOAH
Visualization prepared by: Alcazar
Visualization powered by: MapLibre GL / Lupain.AI stack